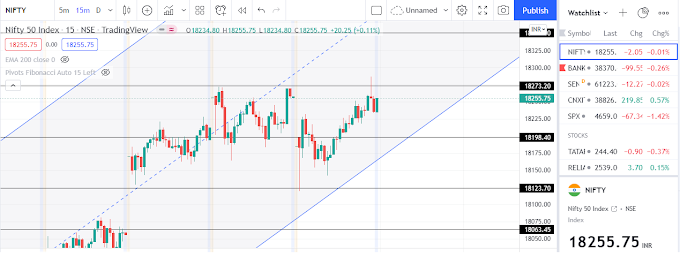
Support and Resistance Levels: Help Identify Entry and Exit Points
Introduction to Support and Resistance Levels
Support and resistance levels are fundamental concepts in technical analysis. These are horizontal price levels that act as barriers, preventing the price of an asset from moving beyond them.
- Support: A price level where the price tends to stop falling and starts to rise due to increased buying pressure.
- Resistance: A price level where the price tends to stop rising and starts to fall due to increased selling pressure.
Why Support and Resistance Matter in Trading
These levels are crucial for:
- Identifying Market Turning Points: They indicate potential reversal zones.
- Planning Entry and Exit Points: Traders can strategically plan their trades based on these levels.
- Risk Management: They help set stop-loss and take-profit levels.
Understanding support and resistance levels allows traders to interpret market sentiment and price action better, helping them make informed decisions.
How to Identify Support and Resistance Levels
Support Levels:- Look for price points where the asset’s price has previously reversed from a downward move to an upward one.
- In the chart provided, the price consistently bounced upward from the 24,142.95 level, demonstrating strong support.
- Identify price points where the asset’s price struggled to move higher and reversed downward.
- In the chart example, the price repeatedly reversed downward from the 24,355.80 level, marking it as a strong resistance zone.
- Confirm these levels across different timeframes to strengthen their validity.
Tips for Using Support and Resistance in Trading
- Combine with Other Indicators: Use tools like trendlines, volume analysis, or moving averages to confirm these levels.
- Watch for Breakouts and Breakdowns: When the price crosses a support or resistance level, it often signals the start of a new trend.
- Set Alerts: Platforms like TradingView allow you to set price alerts when these levels are reached or breached.
Chart Example: Support and Resistance on Nifty 50
In the chart:
- The horizontal blue lines at 24,355.80 (resistance) and 24,142.95 (support) clearly define key levels where the price has reacted multiple times.
- The repeated rejection from the resistance level (red arrows) and the rebounds from the support level (green arrows) showcase their importance.
- A potential bullish divergence is visible near the bottom-right corner, suggesting possible upward momentum after testing the support level.
This chart is an excellent example of identifying support and resistance, as it demonstrates:
- Clear price action at these levels.
- Multiple tests of the levels, which strengthen their significance.
Conclusion
Mastering the identification and use of support and resistance levels is a vital skill for traders. These levels provide a roadmap for market behavior, enabling traders to make well-informed decisions. By combining them with other technical tools and closely monitoring price action, traders can enhance their strategies and improve their odds of success.
Disclaimer
The information provided in this blog is for educational and informational purposes only and should not be construed as financial or investment advice. Trading and investing in financial markets involve risk and may not be suitable for all investors. Past performance is not indicative of future results. Always conduct your own research and consult with a licensed financial advisor before making any trading or investment decisions. The author and publisher of this blog are not responsible for any losses or damages resulting from the use of the information provided.


0 Comments