Nifty50 Analysis for December 2, 2024
Market Overview
The Nifty50 index on November 29, 2024, closed at 24,131.10, marking a gain of 216.95 points (+0.91%) from the previous close. The trading session opened at 23,927.15, reached a high of 24,188.45, and recorded a low of 23,927.15, reflecting a bullish sentiment throughout the day.
The market showed strong momentum as investors responded positively to global cues and optimistic domestic indicators. The overall volume remained robust, signaling increased participation from both institutional and retail traders.
Key Support and Resistance Levels
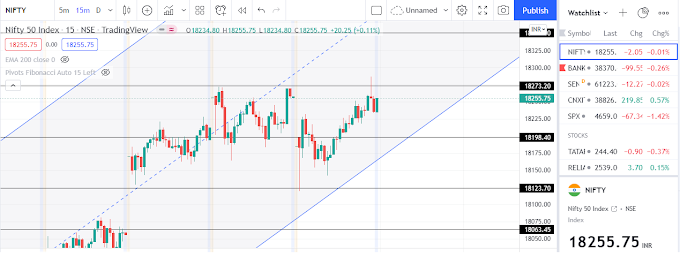
Using the attached chart and technical analysis, the following support and resistance levels can be identified for December 2, 2024:
Resistance Levels:
- 24,180.55 – Immediate resistance level to watch. A breakout above this can push the index toward higher levels.
- 24,356.90 – Strong resistance that aligns with previous selling pressure.
- 24,442.75 – Critical resistance zone that could act as a ceiling for upward momentum.
Support Levels:
- 24,056.80 – Closest support for the index.
- 23,979.60 – Secondary support; a break below this might signal further downside.
- 23,807.60 – Key support that coincides with earlier consolidation zones.
Trading Strategy for December 2, 2024
Bullish View:
- If Nifty50 sustains above 24,180.55, traders may look for long opportunities targeting 24,306.00 and 24,442.75.
- Indicators like RSI and MACD suggest bullish momentum if the index breaks out of its current consolidation range.
Bearish View:
- On the downside, if Nifty50 breaks below 24,056.80, short positions could target 23,979.60 and 23,807.60.
- Increased selling pressure near resistance zones could signal weakness.
Key Insights from the Broader Market
- Sectoral Performance: Banking and IT stocks showed resilience, while energy and auto sectors saw minor corrections.
- Global Cues: Mixed trends in global indices, with U.S. markets closing slightly positive, while Asian indices reflected caution.
- Economic Calendar: Investors are awaiting GDP growth data and interest rate decisions, which could impact market sentiment.
Conclusion
The Nifty50 index showcased strong bullish momentum on November 29, 2024. Traders are advised to monitor key levels and adapt to any breakout or breakdown scenarios. Keeping an eye on global cues and upcoming domestic economic data will be crucial for setting short-term market direction.
Disclaimer: All information provided on this website is intended solely for educational purposes. Readers are strongly advised to conduct their own analysis and research before making any trading or investment decisions. If you intend to trade or invest based on the content provided here, please consult with a certified financial advisor or investment professional. We are not responsible for any financial profits or losses resulting from your trading actions. Please note that the targets shared are based on analysis and market conditions, and there is no guarantee they will be achieved. Use the information at your own discretion.
Chart Reference: The chart used for this analysis is attached above, highlighting support and resistance levels based on historical price action.


0 Comments